Data Visualisation With spmap and ffmpeg
One thing I noticed in my career as a research assistant is that it is extremely difficult to get regional level socio-economic data in Ethiopia. In a country where the federal system is designed along ethnic fault lines and regional disparities is increasingly becoming a hot issue, such data would have helped us see the real picture on the ground. If we are lucky to get data of our interest and wish to compare results visually so that we communicate easily with the public, here is a step-by-step guide on how to achieve it. But I assume you are familiar with STATA and have installed on your PC.
In the example, we will be using education data from the Central Statistical Agency of Ethiopia. For mapping we will be using the spmap command in STATA. The command uses geodata converted from shapefile into STATA .dta format using shp2dta command. We will be using geographic data for the regions of Ethiopia from the Global Database of Administrative Areas (GADM). Finally, to convert graphs/maps into video (mp4 mpeg, or gif formats) we will be using ffmpeg which is a freely available software.
Before you start make sure that you save all the necessary data in one folder and set this folder as current directory in STATA. In the example, all my data are saved in the folder “EDU” and I start by setting the CD as you can see in the command below.
Let´s go and crack it down … 😉
Step 1. Fetching annual education data from the CSA.
- The data covers primary and secondary school coverage both in public and private schools over the time period 2003 – 2012 (1994-2001 Ethiopian Calendar).
- This data is available at regional level.
Step 1a. Fetch the data manually and present it in “wide” format:
Columns: id region regcode public1994 private1994 … public2002 private2002
Rows: 11 (9 regions + 2 Adminstrative Zones) (id:1-11)
Note: Education data for Year 2000 is not available.
Step 1b. Convert wide into long format and save
cd "/Volumes/DATA/SPMAP/EDU/“  //setting current directory
use edu94.dta //manually fetched data and presented in wide format
reshape long private public, i(id) j(year)
save  edu94long.dta
Step 2. Download shapefile for your study area (Ethiopia)
Available at GADM.
The country level administrative boundaries map comes with three admin levels: Admin1 – Admin3. For our purpose we use admin1 which is the same as regions of Ethiopia (file name: “ETH_adm1”). Note that the shapefile has four components: .shp .shx .dbf and .dbn. But we need only the .shp and .dbf formats in using spmap.
Step 3a. Install spmap & shp2dta and
Step 3b. Convert Shapefile to dta (stata) format using shp2dta
ssc install spmap
ssc install shp2dta

shp2dta using ETH_adm1, database(ethdata1) coordinates(ethcoord1) genid(id2)
The command creates a database and a coordinate file and saves them as “ethdata1.dta” and “ethcoord1.dta”, respectivelly. It also generates a common id (id2) included in both files. This id will be used later to mapping the data onto the coordinates.
Step 4. Merge your converted data (ethdata1.dta) with your statistical data (eth94long.dta). The common variable in our example is regcode (regional Code: TG AF AM OR SM BG SNNP GM HR AA DD)
use ethdata1.dta, clear
merge 1:1 regcode using "edu94.dta"
save edu94long_spmap
Step 5. Premapping Preparations
- Generate new variables by dividing the regional education data by regional population (using 2007 census data). Label the new variables appropriately so that you can use them in title of the output map.
- Read data in year 2001 and 2002 as data in year 2000 and 2001, respectively. I did this only for convenience since data for year 2000 is not available. It will avoid breaks when running a loop function.
- Test mapping on a single variable and single year
gen rpublic=public/rpop
label var rpublic "Students in Public School (%)"

gen rprivate=private/rpop
label var rprivate "Students in Private School (%)"

gen redut=edutot/rpop
label var redut "Students in Private and Public Schools (%)“

replace year=year-1 if year>2000

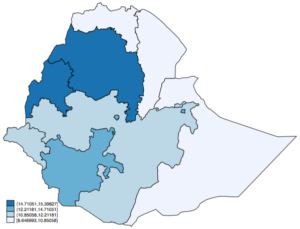
spmap redut using ethiocoor1 if year==1997, id(id2) fcolor(Blues)
spmap ledu1997
The spmap command above maps total number of students in primary and secondary schools (in log) by region for the year 1997.
.
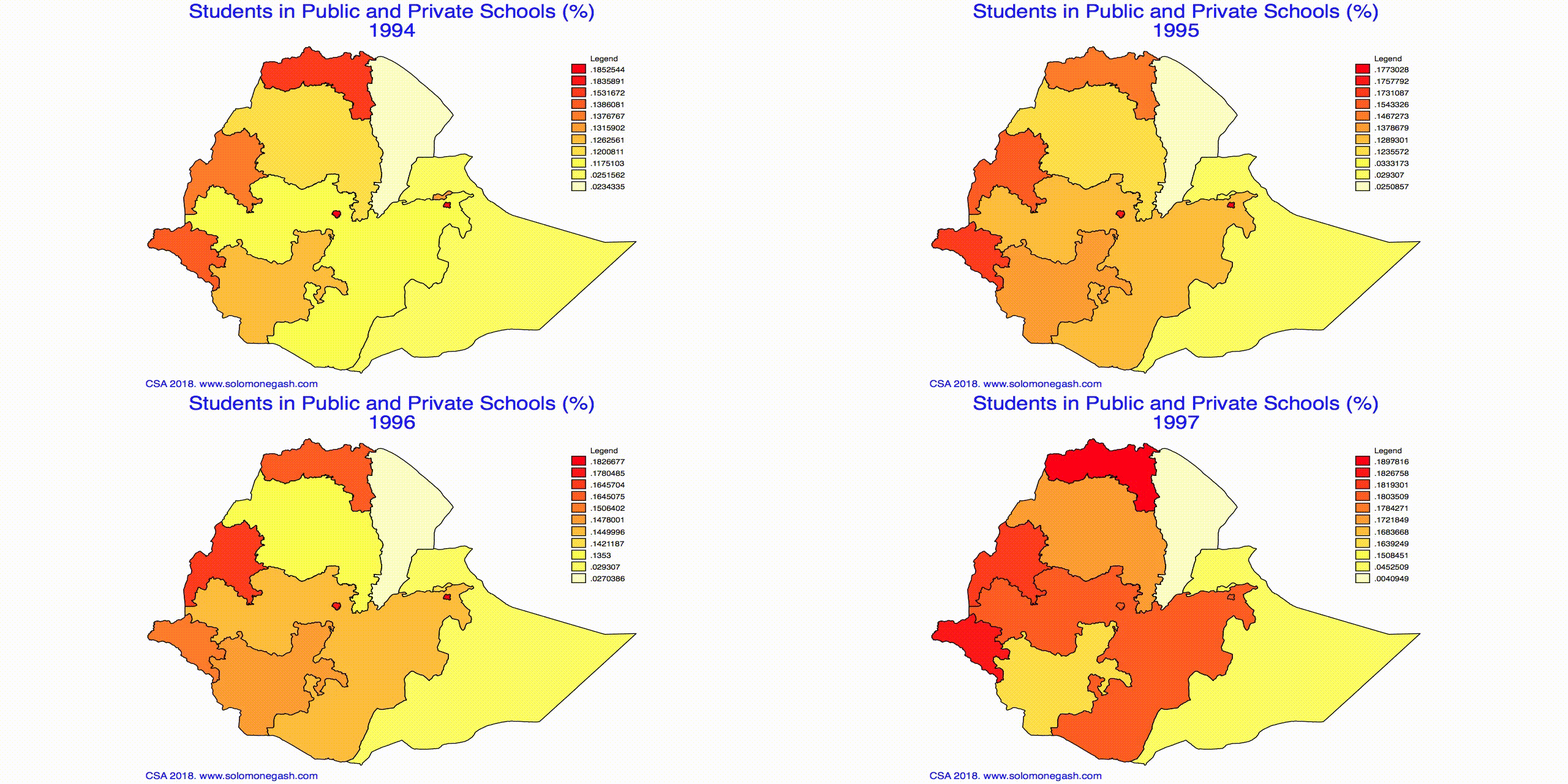
Step 6. Generate timeseries maps – the loop function below generates timeseries maps starting from 1994 to 2001 for each of the variables listed in the function. The output maps will be saved in the current directory.
qui foreach x of var rpublic rprivate redut {
local z: variable label `x'
forvalues year = 1994(1)2001{
   spmap `x' using ethiocoor1.dta if year==`year', id(id) fcolor(Heat) clmethod(unique) ndfcolor(gray) title("`z'" `year', color(blue)) ysize(8) xsize(14) legt("Legend") legend(pos(1)  size(*.95) symx(*.95) symy(*.95) forcesize ) lego(hilo)  note(CSA 2018. www.solomonegash.com, pos(7) size(*.95) color(blue) )
    local year=string(`year'-1994, "%03.0f")
	graph export `x'_`year'.png, as(png) width(1280) height(640) replace
}
}
Step 7. The above loop function returns 7 graphs for each variable (7*3=21). For a better visualisation, we convert these graphs into mp4, mpg, or gif using ffmpeg – an open source software.
- On Windows, we can execute the winexec command below directly from STATA. The command locates and launches the application ffmpeg.exe to convert the ledu.png graphs in the current directory to video (mpg) format. The output will be saved in the same directory. If we rather prefer saving in gif format, the second command will do for us.
local EDUmap "/Volumes/DATA/SPMAP/EDU/"

winexec "E:FFmpegbinffmpeg.exe" -i `EDUmap'redut_%03d.png -b:v 512k `EDUmap'redut.mpg
winexec "E:FFmpegbinffmpeg.exe" -r 10 -i `EDUmap'redut.mpg -t 10 -r 10 `EDUmap'redut.gif- On Mac, we can execute similar command from Terminal to convert maps into mp4 and mp4 file to gif.
/Volumes/DATA/SPMAP/ffmpeg/ffmpeg -r 2 -i /Volumes/DATA/SPMAP/EDU/redut_%03d.png -pix_fmt yuv420p redut.mp4

/Volumes/DATA/SPMAP/ffmpeg/ffmpeg -r 5 -i /Volumes/DATA/SPMAP/EDU/redut.mp4 -t 2 -r 2 redut.gif
Done! Now we have produced our first visualisation map using spmap and ffmpeg.
******

Leave a Reply
Want to join the discussion?Feel free to contribute!